Guinea pig/Vollum Strain model data [1]
| Dose |
Dead |
Survived |
Total |
| 200 |
0 |
4 |
4 |
| 2000 |
0 |
8 |
8 |
| 2E+04 |
6 |
6 |
12 |
| 2E+05 |
10 |
2 |
12 |
| 2E+06 |
7 |
1 |
8 |
| 2E+07 |
7 |
0 |
7 |
|
Goodness of fit and model selection
| Model |
Deviance |
Δ |
Degrees
of freedom |
χ20.95,1
p-value |
χ20.95,m-k
p-value |
| Exponential |
29.2 |
26.6 |
5 |
3.84
2.46e-07 |
11.1
2.11e-05 |
| Beta Poisson |
2.58 |
4 |
9.49
0.631 |
| Beta-Poisson fits better than exponential; cannot reject good fit for beta-Poisson. |
|
Optimized parameters for the beta-Poisson model, from 10000 bootstrap iterations
| Parameter |
MLE estimate |
Percentiles |
| 0.5% |
2.5% |
5% |
95% |
97.5% |
99.5% |
| α |
5.49E-01 |
2.55E-01 |
3.03E-01 |
3.32E-01 |
5.51E+00 |
2.45E+03 |
6.16E+03 |
| N50 |
2.85E+04 |
1.00E+04 |
1.25E+04 |
1.43E+04 |
6.57E+04 |
7.85E+04 |
1.09E+05 |
|
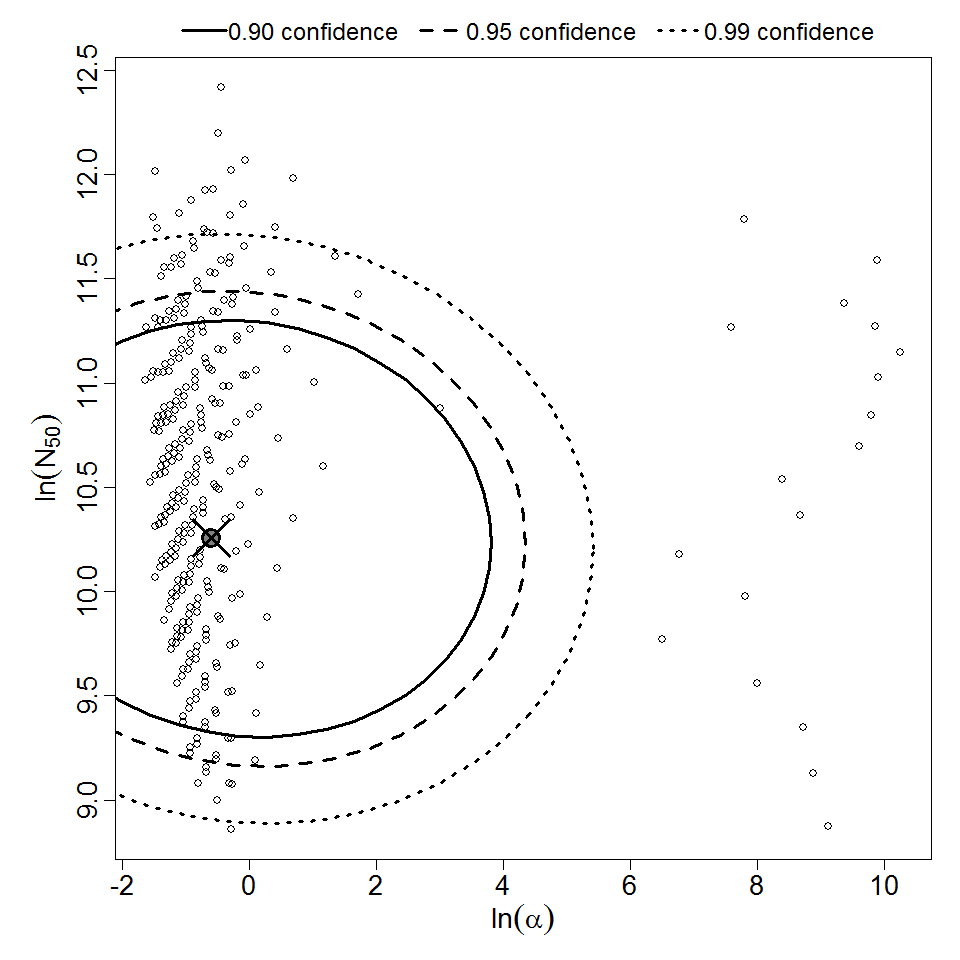
Parameter scatter plot for beta Poisson model ellipses signify the 0.9, 0.95 and 0.99 confidence of the parameters.
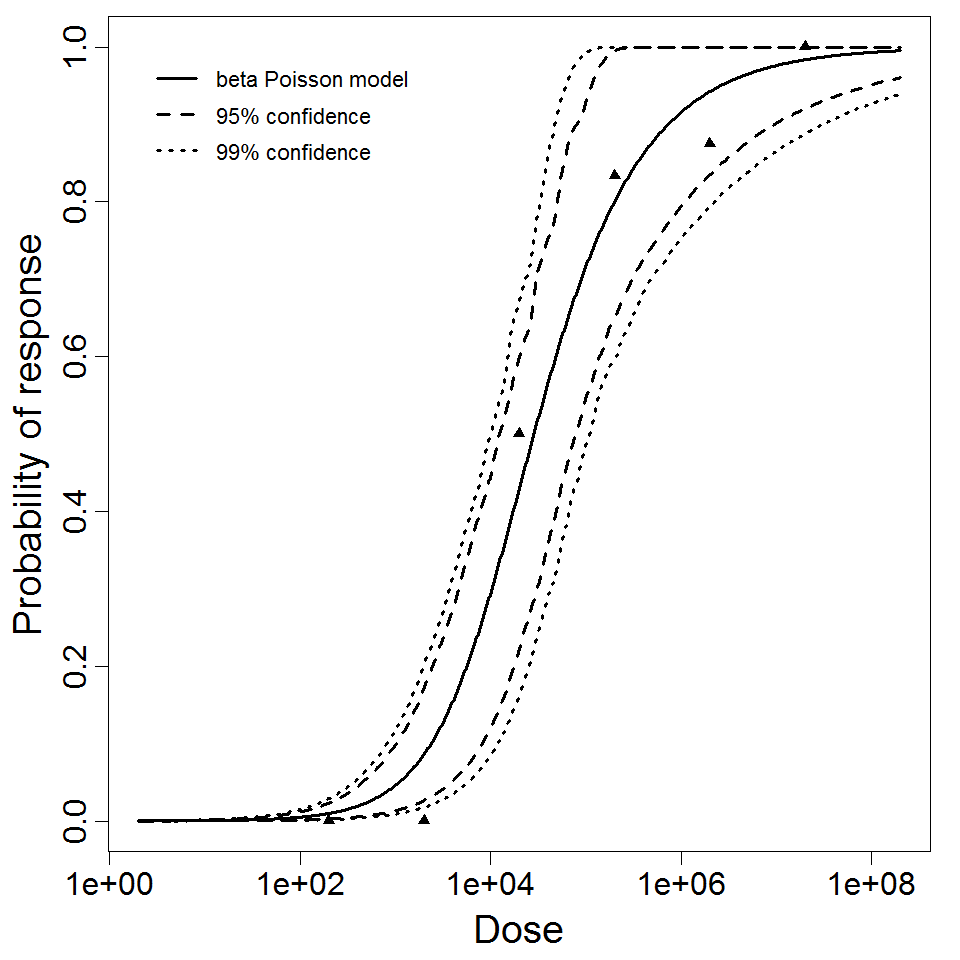
beta Poisson model plot, with confidence bounds around optimized model
References