E. coli disease (ETEC, EPEC, EIEC) in the human model data
| Dose |
Mild to severe diarrhea |
No mild to severe diarrhea |
Total |
| 1E+04 |
0 |
5 |
5 |
| 1E+04 |
0 |
5 |
5 |
| 1E+06 |
0 |
5 |
5 |
| 1E+06 |
1 |
8 |
9 |
| 1E+08 |
1 |
4 |
5 |
| 1E+08 |
5 |
3 |
8 |
| 1E+08 |
3 |
2 |
5 |
| 1E+08 |
2 |
3 |
5 |
| 1.43E+08 |
6 |
2 |
8 |
| 2.7E+08 |
9 |
7 |
16 |
| 1.73E+09 |
5 |
2 |
7 |
| 5.33E+09 |
6 |
2 |
8 |
| 1E+10 |
4 |
1 |
5 |
| 1E+10 |
3 |
2 |
5 |
| 1.6E+10 |
7 |
1 |
8 |
|
Goodness of fit and model selection
| Model |
Deviance |
Δ |
Degrees
of freedom |
χ20.95,1
p-value |
χ20.95,m-k
p-value |
| Exponential |
119 |
113 |
14 |
3.84
0 |
23.7
0 |
| Beta Poisson |
6.56 |
13 |
22.4
0.924 |
| Beta-Poisson fits better than exponential; cannot reject good fit for beta-Poisson. |
|
Optimized parameters for the beta-Poisson model, from 10000 bootstrap iterations
| Parameter |
MLE estimate |
Percentiles |
| 0.5% |
2.5% |
5% |
95% |
97.5% |
99.5% |
| α |
1.78E-01 |
9.39E-02 |
1.09E-01 |
1.19E-01 |
3.21E-01 |
3.63E-01 |
4.77E-01 |
| N50 |
8.6E+07 |
1.75E+07 |
2.62E+07 |
3.25E+07 |
2.63E+08 |
3.23E+08 |
5.21E+08 |
|
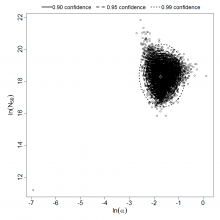
Parameter scatter plot for beta Poisson model ellipses signify the 0.9, 0.95 and 0.99 confidence of the parameters.
beta Poisson model plot, with confidence bounds around optimized model