Rhesus monkey Data [1]
| Dose |
MORBIDITY |
NOT MORBIDITY |
Total |
| 25 |
1 |
3 |
4 |
| 66 |
2 |
0 |
2 |
| 83 |
2 |
0 |
2 |
| 99 |
2 |
0 |
2 |
| 182 |
7 |
0 |
7 |
| 1110 |
1 |
1 |
2 |
| 1770 |
2 |
0 |
2 |
| 2290 |
2 |
0 |
2 |
| 2590 |
2 |
0 |
2 |
| 3170 |
2 |
0 |
2 |
| 5060 |
7 |
0 |
7 |
| 5520 |
2 |
0 |
2 |
| 5650 |
2 |
0 |
2 |
| 5670 |
1 |
0 |
1 |
| 7460 |
2 |
0 |
2 |
| 9200 |
2 |
0 |
2 |
| 10800 |
2 |
0 |
2 |
| 16800 |
2 |
0 |
2 |
| 41000 |
2 |
0 |
2 |
| 45500 |
3 |
0 |
3 |
| 53200 |
2 |
0 |
2 |
| 55200 |
2 |
0 |
2 |
| 132000 |
2 |
0 |
2 |
| 149000 |
2 |
0 |
2 |
|
Goodness of fit and model selection
| Model |
Deviance |
Δ |
Degrees
of freedom |
χ20.95,1
p-value |
χ20.95,m-k
p-value |
| Exponential |
27.6 |
16.4 |
23 |
3.84
5.12e-05 |
35.2
0.232 |
| Beta Poisson |
11.2 |
22 |
33.9
0.972 |
| Beta-Poisson fits better than exponential; cannot reject good fit for beta-Poisson. |
|
Optimized parameters for the beta-Poisson model, from 10000 bootstrap iterations
| Parameter |
MLE estimate |
Percentiles |
| 0.5% |
2.5% |
5% |
95% |
97.5% |
99.5% |
| α |
8.58E-01 |
9.77E-04 |
9.77E-04 |
9.78E-04 |
5.70E+06 |
1.41E+08 |
1.62E+11 |
| N50 |
1.88E+01 |
3.58E-01 |
1.81E+00 |
7.74E+00 |
1.02E+03 |
4.02E+03 |
3.71E+04 |
|
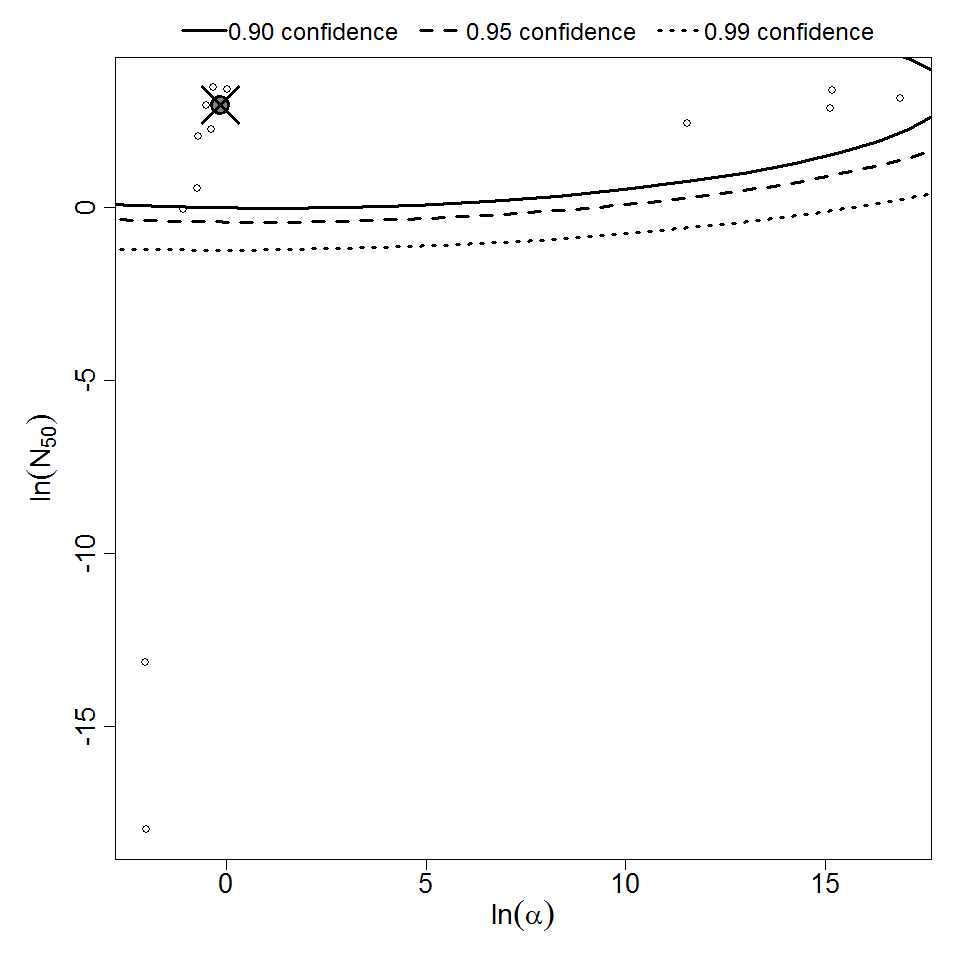
Parameter scatter plot for beta Poisson model ellipses signify the 0.9, 0.95 and 0.99 confidence of the parameters.
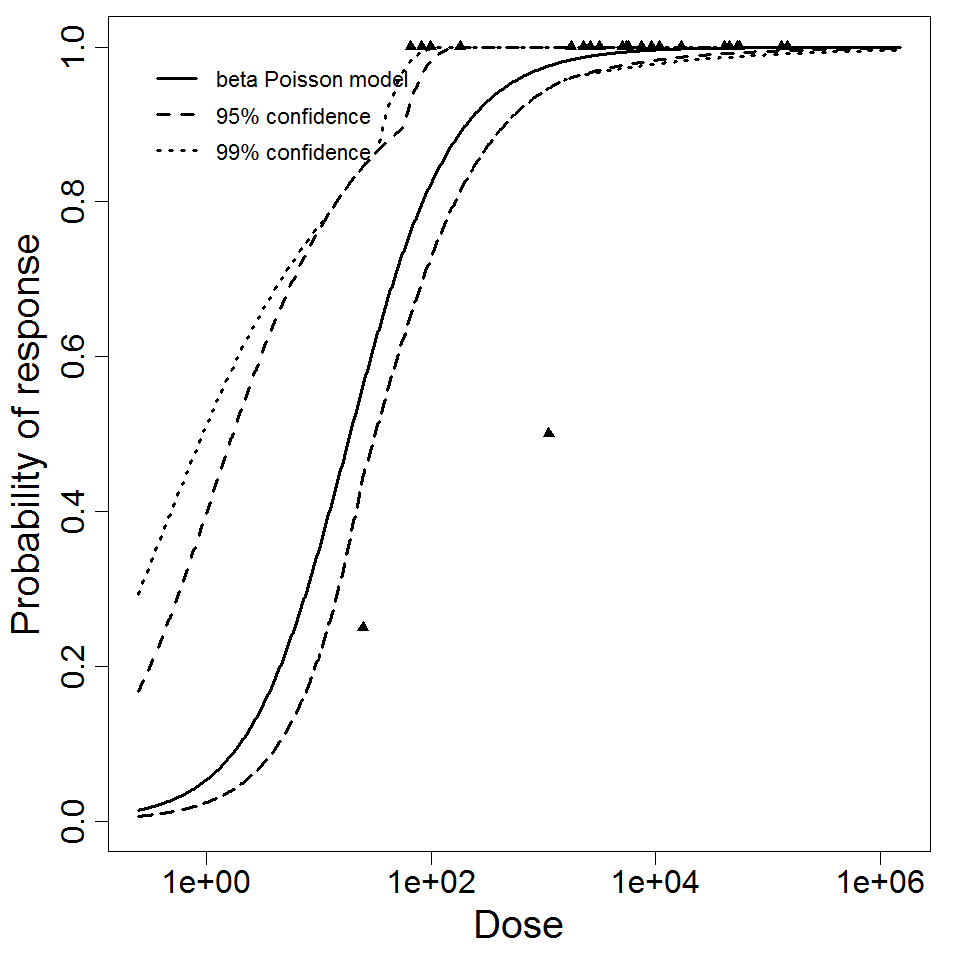
beta Poisson model plot, with confidence bounds around optimized model
References