| Experiment ID | 258 |
|---|---|
| Pathogen | |
| Contains Preferred Model | 0 |
| Reference |
| Host type | |
|---|---|
| # of Doses | 5.00 |
| Μodel | |
| a | 4.29E-01 |
| N50 | 6.66E+05 |
| LD50/ID50 | 6.66E+05 |
| Dose Units | |
| Response | |
| Agent Strain | H3N2,A/Washington/897/80 attenuated strain |
| Exposure Route | |
| Experiment Dataset |
Description:
|
|
||||||||||||||||||||||
|
||||||||||||||||||||||||||||||
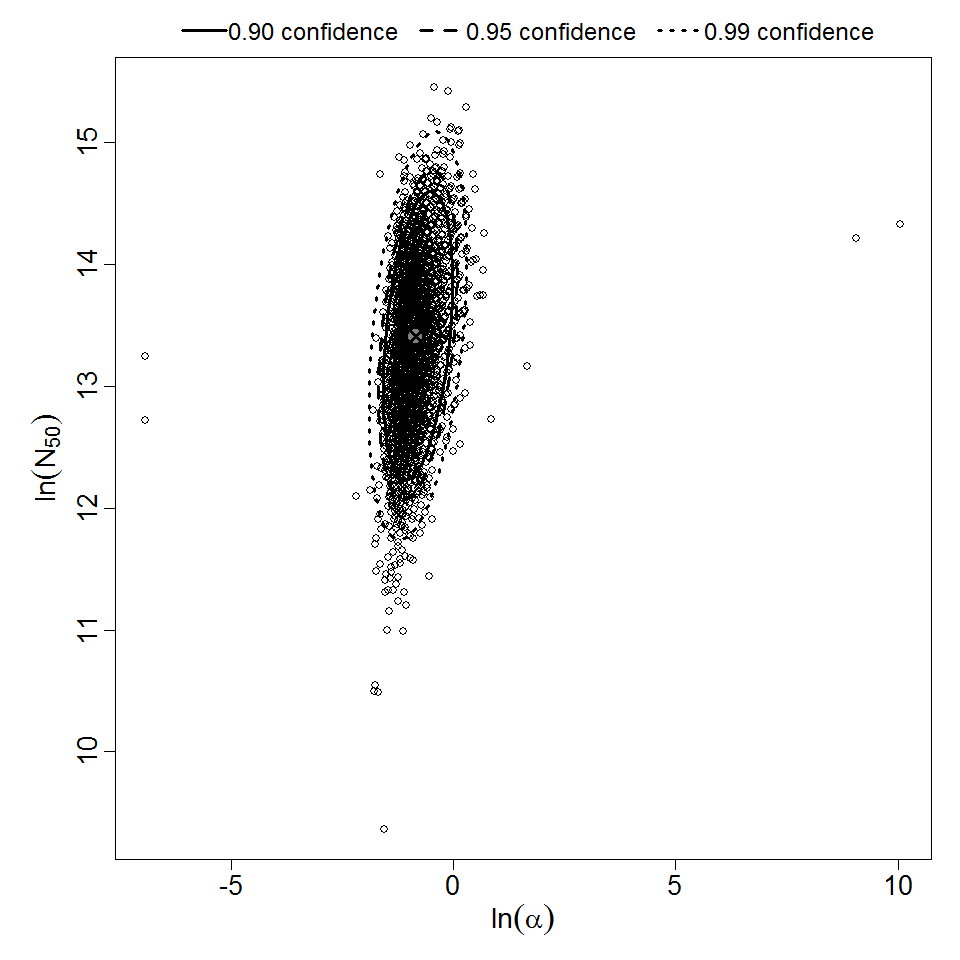
Parameter scatter plot for beta Poisson model ellipses signify the 0.9, 0.95 and 0.99 confidence of the parameters.
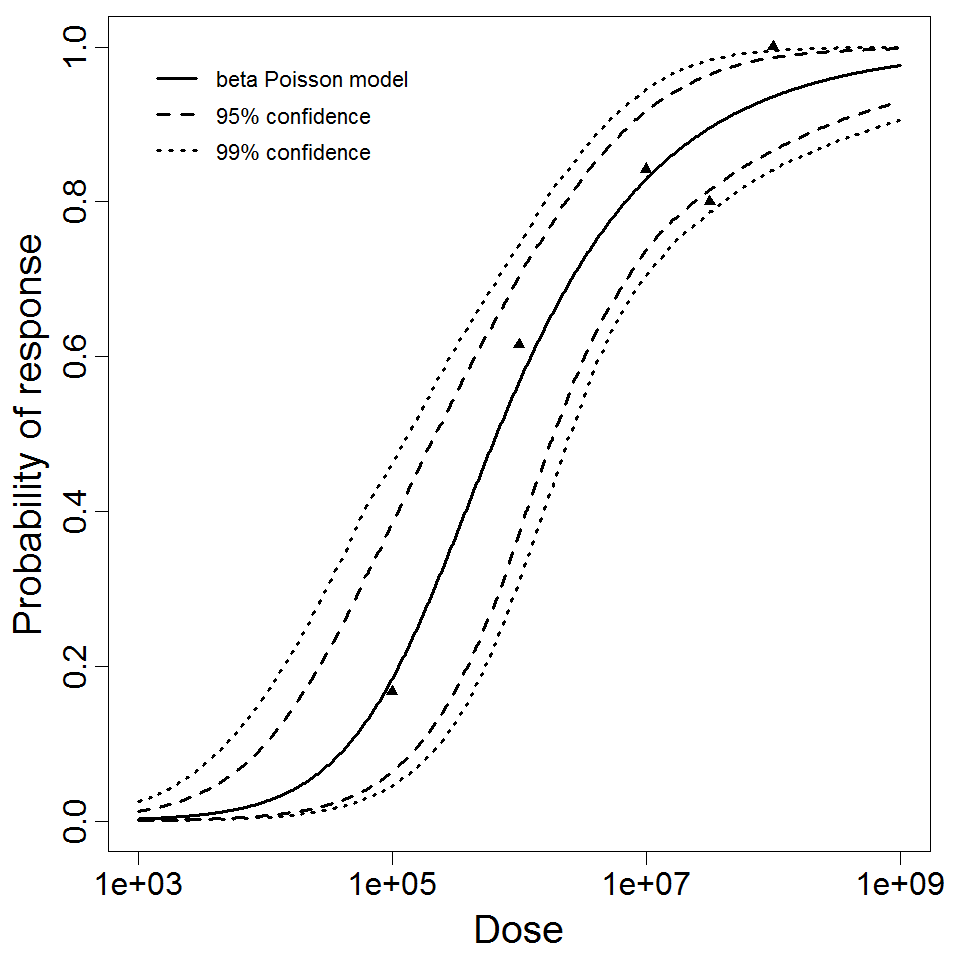
beta Poisson model plot, with confidence bounds around optimized model