Mice/ Salmonella strain 533 data [1]
| Dose |
Dead |
Survived |
Total |
| 1E+04 |
20 |
180 |
200 |
| 1E+05 |
17 |
153 |
170 |
| 1E+06 |
11 |
29 |
40 |
| 3160000 |
6 |
24 |
30 |
| 1E+07 |
12 |
8 |
20 |
| 3.16E+07 |
17 |
3 |
20 |
| 1E+08 |
19 |
1 |
20 |
|
Goodness of fit and model selection
| Model |
Deviance |
Δ |
Degrees
of freedom |
χ20.95,1
p-value |
χ20.95,m-k
p-value |
| Exponential |
214 |
165 |
6 |
3.84
0 |
12.6
0 |
| Beta Poisson |
48.7 |
5 |
11.1
2.56e-09 |
| Neither the exponential nor beta-Poisson fits well; beta-Poisson is less bad. |
|
Optimized parameters for the beta-Poisson model, from 10000 bootstrap iterations
| Parameter |
MLE estimate |
Percentiles |
| 0.5% |
2.5% |
5% |
95% |
97.5% |
99.5% |
| α |
1.08E-01 |
6.19E-02 |
7.06E-02 |
7.52E-02 |
1.79E-01 |
1.98E-01 |
2.44E-01 |
| N50 |
9.66E+06 |
1.93E+06 |
2.43E+06 |
2.82E+06 |
5.38E+07 |
8.11E+07 |
2.13E+08 |
|
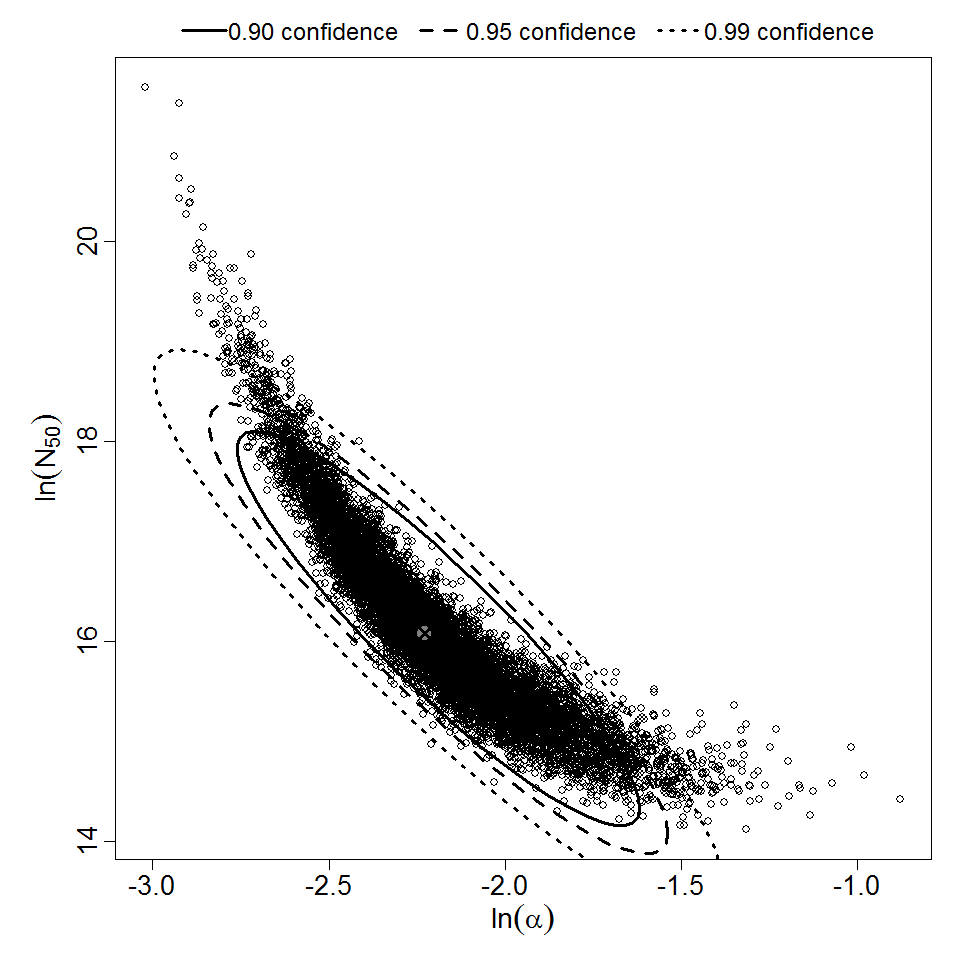
Parameter scatter plot for beta Poisson model ellipses signify the 0.9, 0.95 and 0.99 confidence of the parameters.
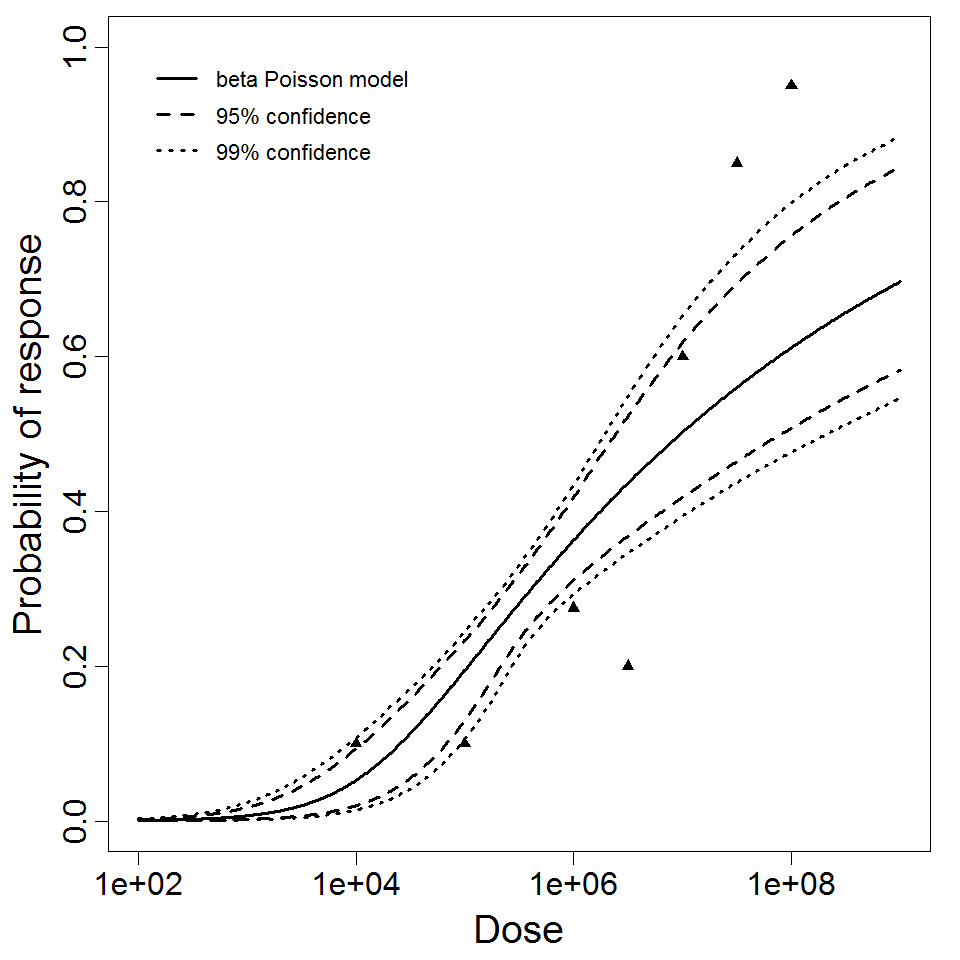
beta Poisson model plot, with confidence bounds around optimized model
References