General Overview
Staphylococcus aureus is a spherical bacterium which on microscopic examination appears in pairs, short chains, or bunched, grape-like clusters. These organisms are gram-positive. Some strains are capable of producing a highly heat-stable protein toxin that causes illness in humans [1].
S. aureus can cause a range of illnesses, from minor skin infections to life-threatening diseases such as pneumonia, meningitis, osteomyelitis, endocarditis, toxic shock syndrome (TSS), bacteremia, and sepsis. It is still one of the five most common causes of nosocomial infections and is often the cause of postsurgical wound infections. Each year, some 500,000 patients in American hospitals contract a staphylococcal infection [2].
http://www.cdc.gov/hai/organisms/staph.html
Summary Data
Singh et al (1971)[3] inoculated the forearm skin of volunteers with known initial doses of S. aureus and measured the infection and bacterial growth kinetic over 6 days. Rose and Haas in 1999 recalculated the initial doses as there was an increase in density of S. aureus after inoculation. The doses inoculated by Singh, Marples et al. in 1971 represent the initial loading of the organism on volunteers' forearms. Over the course of the time there was microbial growth that led to infection. [4] The initial loading of the organism on volunteers is given in the table:
|
Because there was an increase in density of S. aureus after inoculation, the initial inoculum can not be used as a dose parameter in dose-response modeling. To modify the dose, an assumption was made to take into account the effect of contact time using following equation:

A quasimechanistic model of the growth curve was developed to to define the modified dose. Following differential equation was used to estimate the revised doses of infection.
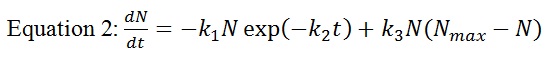
The dose-response analysis was based on the modified doses.[3][4]
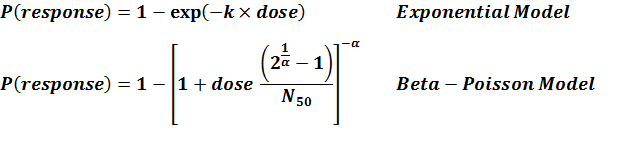
Recommended Model
There is only one available model, hence experiment number 278 is the recommended model.
References
- (2005). Foodborne pathogenic microorganisms and natural toxins handbook—Staphylococcus aureus.
- (1999). Experimental Staph Vaccine Broadly Protective in Animal Studies. National Institute of Allergy and Infectious Diseases.
- (1971). Experimental Staphylococcus aureus infections in humans. Journal of Investigative Dermatology. 57, 149-162.
- (1999). A risk assessment framework for the evaluation of skin infections and the potential impact of antibacterial soap washing. American Journal of Infection Control. 27, 26-33.
| ID | Exposure Route | # of Doses | Agent Strain | Dose Units | Host type | Μodel | LD50/ID50 | Optimized parameters | Response type | Reference |
|---|---|---|---|---|---|---|---|---|---|---|
| 278 | subcutaneous | 6 | CFU/cm2 | human | exponential | 9.08E+06 |
k = 7.64E-08 |
infection | "Effect of Pseudomonas aeruginosa concentration in experimental contact lens-related microbial keratitis." Cornea. 12 (1993): 1. |
k = 7.64E-08
LD50/ID50 = 9.08E+06
|
|
||||||||||||||||||||||
|
||||||||||||||||||||||||||||||||||||||
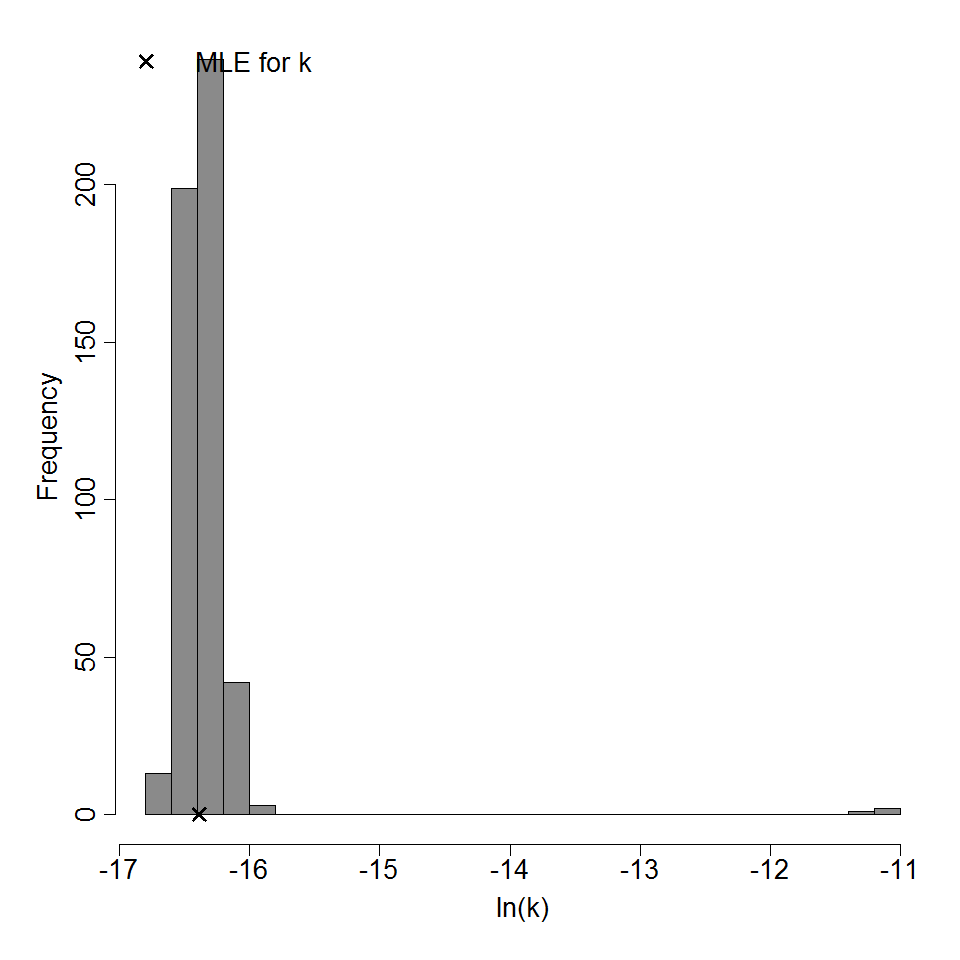
Parameter histogram for exponential model (uncertainty of the parameter)
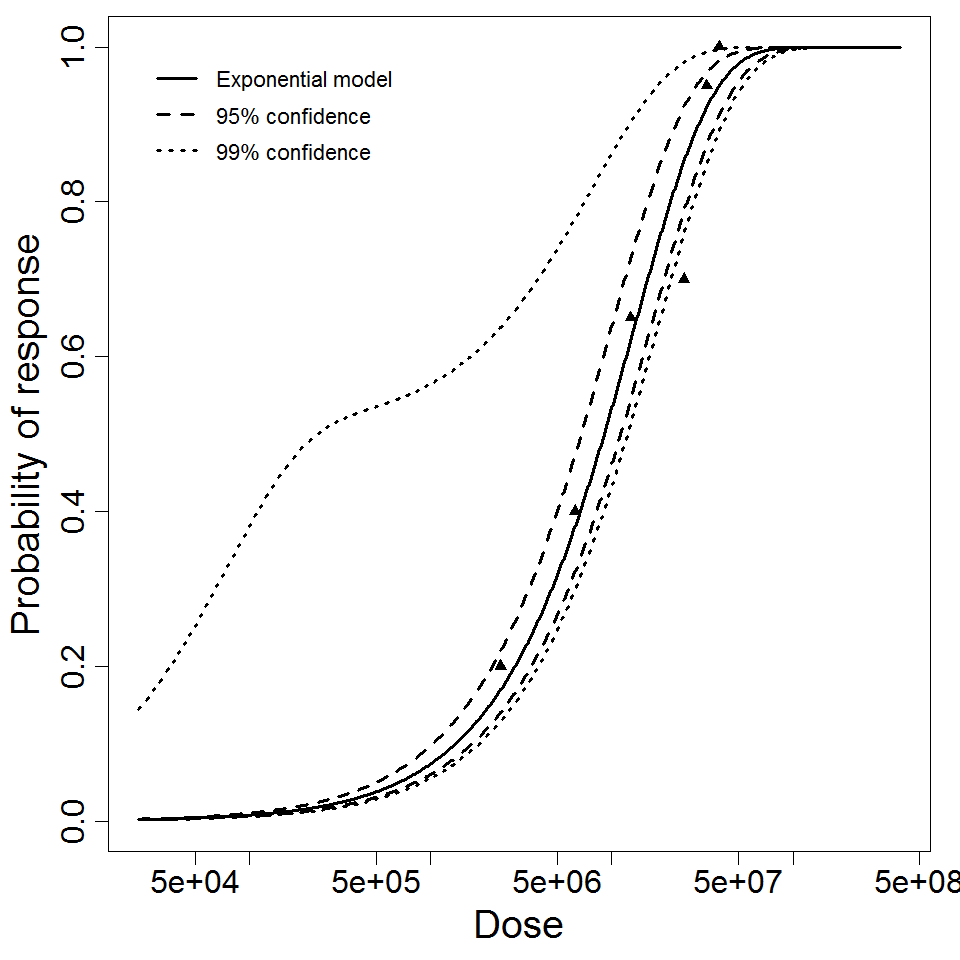
Exponential model plot, with confidence bounds around optimized model