Cost-Benefit Analysis
Economics are essential for determining how much resources should be devoted to reducing a risk. In other words, what dollar amount should be spent to reduce risk by a given amount. As with all economic problems, one must consider risks not in terms of absolute values, but in terms of the incremental differences between alternatives. Often it is not possible to completely eliminate risk; rather one must choose among different risks.
Just as there is no single acceptable threshold of allowable risk, there is also no single appropriate monetized value for risk reduction. Societal willingness to invest in risk reduction depends on the wide range of factors that drive risk perception, such as the dread associated with the risk, its catastrophic potential, etc. In a review [1] of attempts to estimate values from labor market premiums for accepting more dangerous employment, a range of $4-9 million was typical.
Risk assessors typically seek to perform the technical task of providing objective information to risk managers and try to avoid making value judgments or imposing a particular preferred solution. Thus, they are generally cautious about assigning a particular dollar value to a given reduction in risk. Instead analyses are customarily done in terms of cost-effectiveness, in which different prospective risk management measures are evaluated, and quantitative estimates of their costs and reduction in risk are determined. The cost divided by the reduction in risk is the cost- effectiveness of the measure.
One might assume that the most cost-effective solution would be preferred, but this is not necessarily the case. Like most economic goods, risk-reduction strategies tend to exhibit declining marginal returns. One naturally pursues the less expensive measures first, and then if one seeks additional risk reduction, one must pursue more expensive measures. Thus the most cost-effective solution will typically also be the solution their results in the least overall reduction in risk.
An example of one such risk management situation examined the costs and risk reduction achieved by different drinking water standards for arsenic [2]. A standard of 20μg/l was estimated to save 47 lives per year and cost $120 million/year. Its cost- effectiveness is therefore $2.6 million/life saved. If the standard is set at 10μg/l, it was estimated that compliance would cost $300 million/year and 55 lives would be saved for a cost-effectiveness of $5.5 million/life. However, this is not the appropriate manner in which to assess the cost-effectiveness of the 10μg/l standard. Instead one should consider the additional, or incremental, lives saved and the additional costs incurred by selecting 10 instead of 20. From an intuitive viewpoint, most of the lives saved by the 10μg/l standard will also be saved by the 20μg/l standard. One should not give the 10μg/l standard credit for these lives which would have been saved by the less costly standard. A similar argument applies on the cost side. Thus the appropriate estimate of the cost effectiveness of the 10 μg/l standard is:
(cost of 10μg/l - cost of 20 μg/l) – (benefit of 10μg/l - benefit of 20 μg/l)
Using the numbers from [2] :
(300-120) / (55-47) = $22.5 million/life.
Note that this incremental value is much greater than the average value of $5.5 million/life. A decision to regulate at 10μg/l implies a value of statistical life that is greater than $22.5 million/life, while a decision to set the standard at 20μg/l implies a value of statistical life that is less than $22.5 million but greater than 2.6 million.
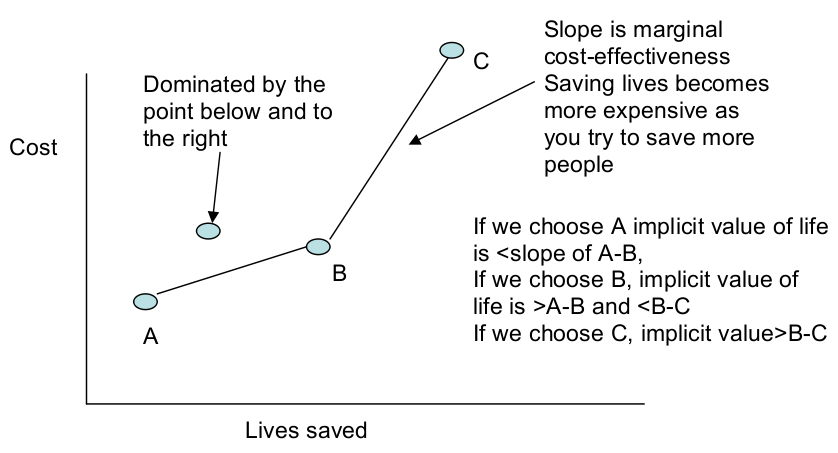
Comparing risk management options. The slope of the line ($/lives) is the value of a statistical life (VSL).
The figure on the right shows a simple example of how this type of analysis can be conducted for multiple, discrete risk management options. Based on technical knowledge, the analyst first calculates the risk reduction and costs of each option. Each option can then be plotted as a point with lives saved on the x-axis and cost on the y-axis. A point which is above and to the left of another option is dominated by the other option, because this other option offers greater risk reduction at lower cost (i.e., is superior on both attributes). The set of non-dominated options can thus be connected by an upward sloping line. Due to decreasing marginal returns, the slope is almost always continuously increasing. Thus one can calculate the slope of the line connecting the point in the lowest left corner to the next highest and to the right. This slope is the incremental cost effectiveness of implementing the more costly measure. Decision makers can then be informed that selecting an option to the right of a given line implies a statistical value of life larger than the slope of the line. Likewise, selection of an option to the left of a given line implies a value of life lower than the slope of the line.
A basic cost-benefit example is also presented in this spreadsheet: File:RiskMgtAnthraxDeconExample.xls
Decision Analysis
Decision analysis describes determination of appropriate courses of action based on available information about risks and costs. Although it is always desirable to reduce risks, at some point further risk reduction is too expensive.
As a simple example, consider the decision of whether to stockpile smallpox vaccine in preparation for a future bioweapons attack. An attack is unlikely, but would be extremely severe if it occurred. The attack would be less severe if smallpox vaccine was available, but stockpiling vaccine has a cost.
Therefore, if we choose to stockpile, the expected cost is:
0.0001 x $83E12 + 0.9999 x $3.3E9 = $3.3E9
If we choose not to stockpile, the expected cost is:
0.0001 x $150E12 + 0.9999 x 0 = $15E9
Since the expected cost of stockpiling is less than the expected cost of not stockpiling, we should choose to stockpile.
Decision trees are usually much more complicated, involving multiple scenarios and choices, as well as incorporation of uncertainties.
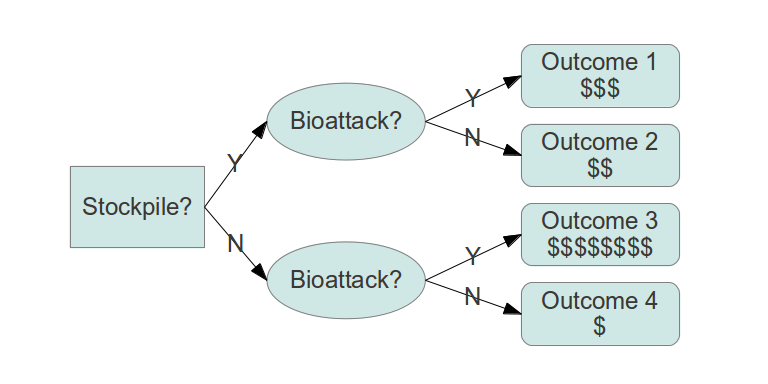
Simple qualitative decision tree.
By assigning probabilities to the arrows and costs to the outcomes, the decision tree becomes quantitative:

Simple decision tree with probabilities and costs.
Examples
Economic Evaluation and Priority Setting in Water and Sanitation Interventions
A chapter of Water Quality: Guidelines, Standards and Health 2001, is dedicated to evaluating how priorities are set in cost-benefit analysis for water and sanitation risk management interventions.[3]
"The economic evaluation guidelines (Drummond and Jefferson 1996) presented in this chapter are recognised to be important in that they reflect consensus among mainstream health economists and they increase consistency and comparability between cost-effectiveness ratios for a wide range of health interventions. However, several limitations or disadvantages were discussed in this chapter when applying these guidelines to water and sanitation interventions. These included uncertainty about which costs and benefits to include in the cost-effectiveness ratio, and the choice of discount rate for future costs and effects. Also, the advantages and disadvantages of different benefit valuation methods need to be understood fully by those undertaking such research, and this chapter provided a brief discussion of issues. There are a number of characteristics of water and sanitation interventions that make them particularly difficult to estimate costeffectiveness with any degree of certainty, including the lack or poor quality of current evidence on costs and effects, and uncertainty associated with generalising cost-effectiveness across settings." [2]
Evaluating the Cost-Effectiveness of Environmental Health Interventions
The WHO developed this document to provide an overview of currently used methods for economic evaluation and discuss the implications of using these methods for evaluating environmental health interventions.[4]
"It has become clear from the examples and discussion in Chapters 4-8 that several issues arise in the economic evaluation of environmental health interventions that are not adequately dealt with in current CEA guidelines. In general, environmental health interventions have a broader range of costs and benefits, many of these costs and benefits fall outside the perspective of the health sector, a range of valuation techniques may be required to capture the benefits, uncertainty is a potentially significant problem, and some environmental health interventions are disadvantaged when discounting is used."[4]
References
- (2003). The value of a statistical life: A critical review of market estimates throughout the world. Journal of Risk and Uncertainty. 27, 1.
- (2001). Benefit-cost estimation for alternative drinking water maximum contaminant levels. Water Resources Research. 37, 8.
- (2001). Water Quality: Guidelines, Standards and Health.
- (220). Considerations in evaluating the cost-effectiveness of environmental health interventions.