Team Members: Silvestri, E., Panzl, B.M., Prasad, B., DeFlorio, S., Adell, A., van Leuken, J..
Problem Statement
GCI is interested in quantification of the risk posed to their customers and employees at their product stores. As the potential for widespread transmission of the pathogen is relatively large – especially during the winter season – the risk might be rather serious.
Therefore, we have calculated this risk for the Influenza virus, which is considered to be one of the most widespread pathogens. With the results we have defined a financially viable and non-intrusive risk management strategy to reduce the infection risk. The stakeholders comprise GCI, its employees, customers, and close relations of the employees and customers (via secondary transmission of the pathogens). As GCI is a worldwide operating company, the results will have global influence.
Hazard Identification
Fomites refer to objects that are likely to contain large reservoirs of viruses and bacteria. Examples of fomites are mobile phones, computer keyboards, and door handles. Hartmann et al. (2003) have performed microbial analyses from samples in hospital rooms, yielding 8.9 % of the samples to contain up to 26 potentially pathogenic microorganisms. Ulger et al. (2009) have performed a sampling of the hands and the mobile phones of 200 healthcare workers. Of these 200 phones, 94.5 % was contaminated with different types of bacteria, and methicillin-resistant Staphylococcus aureus (MRSA) was isolated in 13 % of the cases.
One of the most widespread diseases of relevance is the Influenza virus, which infects the respiratory system. Influenza is mainly transmitted via three primary ways:
1. Airborne transmission of the pathogen after a cough or sneeze.
2. Deposition of the pathogen on the product from the air or from droplets after a cough or sneeze.
3. Deposition of the pathogen on the products from contaminated hands of an infected person.
The Influenza virus infects the respiratory system, which may lead to serious symptoms and even possible mortality among especially elderly people and people with a chronic disease. The regular symptoms comprise headache, fever, coughing, sore throat, sore muscles, a cold, a feeling of weakness, and loss of appetite (CDC[1]). Secondary complications comprise among others pneumonia, bronchitis and secondary bacterial infections (Haas, 1999). Besides, the annual rate of Influenza related death in the U.S. was 1.4 – 16.7 deaths out of every 100,000 persons (CDC[2]).
The annual averaged U.S. prevalence is estimated to be 2.72 % (CDC[3]), and the annual costs attributed to this virus run up to 1 billion dollars (Haas 1999). Combined with the fact that the Influenza virus can remain viable and infectious up to 24 hours on hard and smooth surfaces (Kramer, 2006), and up to 4 – 6 hours on porous surfaces (Bean 1982; Haas, 1999), the risk of infection of every customer is expected to be not negligible.
Exposure Assessment
For the risk assessment, we have simulated the Influenza contamination in one computer store. In all scenarios, it is assumed that one person – either a customer or an employee – is infected by the Influenza virus. This person may infect other (healthy) people by initially aerosolising the virus after a cough. The aerosolised pathogens may be inhaled by the healthy people, or they may deposit on the surface of the products. The calculations were performed with a dose-response model. The calculated risk is extrapolated to all GCI stores in the U.S. in order to calculate an overall risk of illness or mortality.
Exposure Pathway
We have defined six different scenarios for contamination by one infected person (Figure 1). In all scenarios, this person infects one other person. Scenarios 1 – 3 comprise an infected customer (customer A), who will remain in the store for 45 minutes (Apple[4]) and who will cough 6x during this time period (Loudon, 1997). In scenario 1, this customer infects customer B, as this person inhales the contaminated air. In scenario 2, customer C becomes infected after having touched one of the contaminated products. In scenario 3, customer D becomes infected after both having inhaled the contaminated air and after having touched one of the contaminated products. Scenarios 4 – 6 comprise an infected employee, who will be in the store for 3 hours before he is actually leaving. During this period this employee coughs 22x (Loudon, 1997). For the rest, these scenarios are similar to scenarios 1 – 3. Table 1 shows a list of all the values that were used and all other assumptions that were made for the model.


Figure 1. Schematic overview of the risk calculation scenarios. The parenthesised numbers indicate the scenario number.
In addition, the following assumptions are defined:
|
|
|
|
|
|
|
Table 1. Model values and assumptions
| Description | Value | Reference |
| STORE AND ITS PRODUCTS | ||
|---|---|---|
| Air exchange rate | 3 [hr-1] | Weir 2011 (personal communication |
| Humidity | 30 – 50 [%] | EPA (1991) |
| Surface area of the laptops base excl. keyboard | 0.0497 [m2] | Apple[4] |
| Surface area of the laptops keyboard | 0.041 [m2] | Apple[4] |
| Surface area of the smartphone | 0.0067 [m2] | Apple[4] |
| Surface area of the store | 1019.4 [m2] | |
| Surface area of the tablet | 0.0448 [m2] | Apple[4] |
| Temperature | 21 – 23 [°C] (69.8 - 73.4°F) | Olesen (2004) |
| CUSTOMER A AND EMPLOYEE E | ||
| # Droplets expelled (per cough) | 3,000 [-] | Cole[5] |
| # Droplets expelled (per sneeze) | 40,000 [-] | Cole[5] |
| # Viral particles per droplet | 8,833 [-] | Cole[5] |
| Coughing rate | 7.5 [hr-1] | Nicas & Sun (2006) |
| Length of a person | 1.75 [m] | Wikipedia (2011) |
| Emitted particle size | 4 [µm] | QMRA Wiki (2011) |
| VIRUS | ||
| Virus’ decay rate (air) | 0.03 [hr-1] | QMRA Wiki (2011) |
| Virus’ decay rate (fomite) | 9.95 x 10⁻³ [hr-1] | QMRA Wiki (2011) |
| EXPOSED POPULATION | ||
| Residence time (customer) | 45 [min.] | Apple[4] |
| Residence time (employee) | 180 [min.] | Apple[4] |
| Inhalation rate | 0.012 [m3.min-1] | EPA (2009) |
| Viral transfer rate (fomite to hand) | 60 [%] | QMRA Wiki (2011) |
| Transfer rate (fomite to finger) | 49 [%] (plastic) | QMRA Wiki (2011) |
| Transfer rate (fomite to finger) | 67 [%] (glass) | QMRA Wiki (2011) |
| Transfer rate (fomite to finger) | 37.4 [%] (aluminium) | QMRA Wiki (2011) |
| Transfer rate (finger to eye) | 35 [%] | Nicas & Sun (2006) |
| Frequency finger touches (fomite) | 0.2 [min-1] | Nicas & Sun (2006) |
| Frequency finger touches (mouth) | 0.083 [min-1] | Nicas & Sun (2006) |
Exposure Model
Our developed model considers various states of exposures, which all terminate in various ways. States are any physical location where the pathogens are at any given point. The individual rates of removal of the Influenza virus from their respective states are denoted as λ I. (see figure 2). State 1 represents the air in which the (infected) person emits the pathogens. This air is circulating the store and it can terminate either by inhalation of the healthy person (state 2) or in removal out of the building (state 9). Additionally, the pathogen can deposit on surfaces: glass (state 3), plastic (state 4), aluminium (state 5), or non-fomite surfaces (state 6). Non-fomite surfaces are considered to be a terminal endpoint. Glass, plastic and aluminium are typical high-tech materials, which are often touched by the customers. Glass is found on the smartphones and tablet surfaces. Plastic is found on the keyboards of the notebooks and aluminium is the fomite that is in the area around the keyboard. The pathogens in states 3, 4, and 5 can either continue on to the hands of the customers or employees (state 7), or can terminate as decay on the surface itself (State 10). From the hands at state 7, the exposure terminates in state 8, on the face, where the pathogen is ingested.

Figure 2. Model state exposures; all states are connected via different transfer rates, which are a measure for the number of particles transferring from one box to the other.
Loss Rates
The loss rates λi were derived by considering how the pathogen was removed in various states. Therefore, λi varies as the transition between states is also varied. The first loss rate to be considered is λ1,2, where pathogen is in state 1 and is inhaled by a healthy person:
\begin{align*} \lambda_{1,2} = Q_{resp}/V \end{align*}
where Q is the volumetric flow rate of the respiration [m3.s-1], and V is the volume of the store [m3]. The loss rate from State 1 in the air to any of the glass, plastic or aluminium fomites is:
\begin{align*} \lambda_{(1,[3,4,5])} = v_{ts}/H*A_F/(A_S-A_F) \end{align*}
where vts is the terminal settling velocity [m.s-1], H is the height [m], and AF and AS are the surface area of the store and fomite respectively [m2]. Furthermore, the loss rate from state 1 to any non-fomite surface is:
\begin{align*} \lambda_{1,6} = v_{ts}/H*(A_{room}-(A_G + A_P +A_A))/A_S \end{align*}
with AG, AP, and AA the surface areas of the glass, plastic and aluminium parts respectively [m2]. The loss rate from state 1 to state 9 (exhaust) is described below, where Q is the volumetric flow rate of the air in the store [m3.s-1], and V is the volume of the store [m3]:
\begin{align*} \lambda_{1,9} = Q/V \end{align*}
Markov Chain Matrix
From this model sketch, we can move on to the next step, which is to find the probabilities that the Influenza virus will stay in state i during a time step Δt:
\begin{align*} p_{ii}=exp(-\lambda_i*\Delta t) \end{align*}
with pii the probability of remaining in state i. The probabilities of the virus moving from state i to state j is then given by:
\begin{align*} p_{ij}=\lambda_{ij}/\lambda_i * [1-p_{ii}] \end{align*}
The probabilities were then used to build a Markov matrix, which we created as a 10x10 matrix that represents the ten states of the model. A Markov chain is a system that models the transitions from one state to another through a chain-like process, in which the next state depends only on the current state and not the entire past.
We assumed that the pathways are undirectional, meaning that once the pathogen has continued into another state, it does not backtrack to the previous one. Therefore, p31 will be 0, p33 is the probability that the pathogen is in state 3 and will remain in state 3, and p3n is the probability that the pathogen is in state 3 and will continue to state n (thus, n might be 7 or 10).
Monte Carlo Simulation
After the completion of the Markov Chain, we used Crystal Ball® to create stochastic models to estimate the risk from either only breathing, only touching the fomites, and a combination of breathing and touching the fomites for both the 45 minute and 3 hour exposure scenarios. We utilized the data generated by the Markov Chain, which was correlated with the final cough experienced by the person exposed. We only used the data from the final cough since it represented a cumulative exposure over the entire 45 minute or 3 hour time of exposure. The equation that accounts for the dose received by a person breathing contaminated air is:
DoseBreathing=[#viral particles/VAir]x [IR] x [time]
This formula includes information regarding the number of viral particles in the room, which is set up as a distribution, the volume of air in the room, the inhalation rate for a person participating in light activity, as well as the specific amount of time the individual was exposed. For specific values please refer to the assumption table located in Chapter 3.1. The equation that accounts for the dose received by a person touching each individual fomite is:
dose= 〖viral particles〗fomite*Afinger/Afomite *λt*time*ηhand*ηfomite*contact rate
This includes information regarding the number of viral particles on each fomite (plastic, glass, or aluminium), the surface area of a person’s finger, the total surface area of each fomite, the frequency of times a person touches the fomite, the transfer rates for both fomite to hand, and hand to eye, as well as the frequency of times a person comes in contact with their eyes. Distributions were set for the number of viral particles on the fomite, time in contact with the fomite, as well as the contact rate.
Table 2 shows the doses for customers and employees for inhalation and touching the surfaces of the fomites. As indicated in the table, the largest doses are obtained by inhaling the Influenza virus.
Table 2. Dose for customer and employee for inhalation and touching the surfaces of the fomites.
| Dose for Customer (45 Minute Exposure) | |
|---|---|
| Inhalation only | 8.51E+00 |
| Touching only plastic surfaces | 1.57E-07 |
| Touching only glass surfaces | 2.80E-07 |
| Touching only aluminium surfaces | 1.48E-07 |
| Dose for Employee (180 Minute Exposure) | |
|---|---|
| Inhalation only | 1.13E+01 |
| Touching only plastic surfaces | 2.05E-07 |
| Touching only glass surfaces | 3.65E-07 |
| Touching only aluminium surfaces | 1.96E-07 |
Dose Response
The most appropriate model for both an inhalation and ingestion exposure of the Influenza virus is the non-threshold model. This model is based off of the exponential model, which assumes that more than two organisms act independently of one another in the host (Nicas and Sun, 2006). The dose response equation appears below:
R=1-〖(1-α)〗D
This assumes that a single organism can infect a host with a probability α. The number of organisms deposited on target tissue is represented as D, and R is the risk of infection. The α value was estimated using the ID50 found on the CAMRA Wiki site. The relationship between α and ID50 is given by the expression:
〖ID〗50=(ln(2))/α
Here, the ID50 value is the dose that infects 50% of a population with certainty. This definition slightly varies from the definition typically given in other literature. The dose-response model modelled risks for each individual exposure. A risk was generated for an individual who is only breathing, and for contact with each individual fomite (plastic, glass, or aluminium). Subsequent risks were calculated using the inclusion-exclusion formula, which is useful for successfully combining the risks of several different types of exposures. For example, inclusion-exclusion formula for the combined fomite and air exposure appears below assuming that RA¬ is the risk from breathing in the store, RB is the risk from plastic fomite, RC is the risk from the glass fomite, RD is the risk from the aluminium fomite:
E[R]=RA + RB + RC + RD - RARB - RARC - RARD - RBRC - RBRD – RCRD + RARBRC + RARBRD + RARCRD + RBRCRD - RARBRCRD
Risk Characterization
Table 3 shows a summary of the risks of infection for the customer for inhalation and touching different surfaces. For the customer the largest risk is obtained after inhaling the Influenza virus (7.82e-6).
Table 3. Risk of infection for customer
| Risk of Infection for Customer (45 Minute Exposure) | |
|---|---|
| Inhalation only | 7.82E-06 |
| Touching only plastic surfaces | 1.45E-13 |
| Touching only glass surfaces | 2.57E-13 |
| Touching only aluminium surfaces | 1.35E-13 |
| Touching all three fomites | 5.38E-13 |
| Inhalation and touching fomites combined | 7.82E-06 |
Risk to Customer
The distribution of inhalation risks fit a gamma distribution and is plotted in Figure 3. Sensitivity analysis indicated that the variable that caused the biggest influence in the model was α (82%), followed by number of viral particles (17.9%).
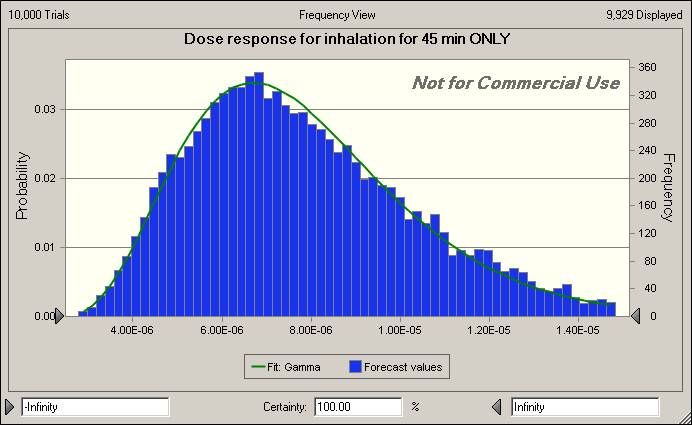
Figure 3. Distribution of Inhalation Risk for Customers
Risk of infection from touching each fomite surface showed risk in the order of 10-13 for each surface (see Table 4). Sensitivity analysis on each fomite showed that the variable that had the largest influence on the model was contact rate. Risks of infection for each surface type were combined using the inclusion-exclusion model for a total surface risk of infection of 5.38e-13. Risk of infection from inhalation and risk of infection from contact with a contaminated surface was combined using the inclusion-exclusion model for a total risk of 7.82E-06. The distribution for combined risk of infection from inhalation and contact with contaminated surface is shown in Figure 4.
Table 4. Sensitivity Analyses by Fomite Type
| Touching Only Plastic Surfaces | |
|---|---|
| Contact Rate | 95.20% |
| Concentration on Plastic | 3.80% |
| α | 0.50% |
| Time | 0.40% |
| Touching Only Glass Surfaces | |
|---|---|
| Contact Rate | 95.50% |
| Concentration on Glass | 3.50% |
| Time | 0.30% |
| Touching Only Aluminum Surfaces | |
|---|---|
| Contact Rate | 95.20% |
| Concentration on Plastic | 4.30% |
| Time | 0.40% |
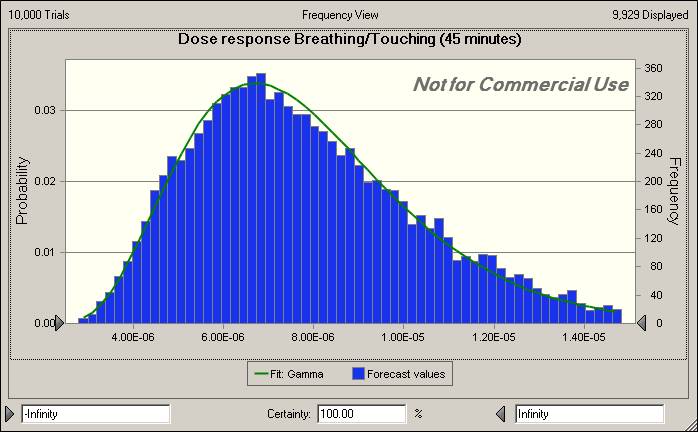
Figure 4. Distribution of Touching Risk for Customers
Risk to Employee
Table 5 shows a summary of the risks of infection via inhalation and contact with contaminated surfaces for the employee. For the employee, the largest risk is also obtained after inhaling the Influenza virus (1.03e-5) and was one order of magnitude higher than the risk to the customer (7.82E-6).
Table 5. Risks of Infection via Inhalation and Contact with Contaminated Surfaces for the Employee.
| Risk of Infection for Employee (180 Minute Exposure) | |
|---|---|
| Inhalation only | 95.20% |
| Touching only plastic surfaces | 1.88E-13 |
| Touching only glass surfaces | 3.35E-13 |
| Touching only aluminium surfaces | 1.80E-13 |
| Touching all three fomites | 7.04E-13 |
| Inhalation and touching fomites combined | 1.03E-05 |
The distribution of inhalation risks fit a beta distribution and is plotted in Figure 5. Sensitivity analysis indicated that the variable that caused the biggest influence in the model was α (87%), followed by number of viral particles (12.8%).
.jpg)
Figure 5. Distribution of Inhalation Risk for Workers
Risk of infection from touching each fomite surface showed risk in the order of 10-13 for each surface (see Table 4.4) which fell on the same order of magnitude as the risk to the customer. Sensitivity analysis on each fomite showed that the variable that had the largest influence on the model was the concentration on the surface (See Table 4.5). Risks of infection for each surface type were combined using the inclusion-exclusion model for a total surface risk of infection of 7.04E-13. Risk of infection from inhalation and contact with a contaminated surface was combined using the inclusion-exclusion model for a total risk of 1.03E-05, which was one order of magnitude higher than the risk to the customer (7.82E-6). The distribution for combined risk of infection from inhalation and contact with contaminated surface is shown in Figure 4.4.
Table 6. Sensitivity Analysis for Risk of Infection for Plastic, Glass, and Aluminium.
| Touching Only Plastic Surfaces | |
|---|---|
| Concentration on Plastic | 49.30% |
| Contact Rate | 42.80% |
| α | 4.90% |
| Time | 2.90% |
| Touching Only Glass Surfaces | |
|---|---|
| Concentration on Glass | 49.00% |
| Contact Rate | 42.70% |
| α | 5.10% |
| Time | 3.10% |
| Touching Only Aluminum Surfaces | |
|---|---|
| Concentration on Aluminum | 48.20% |
| Contact Rate | 42.90% |
| α | 5.10% |
| Time | 3.70% |
.jpg)
Figure 5. Distribution of Ingestion Risk for Workers
Model Assumptions and Limitations
We chose to model the spread of the Influenza virus, because it is well characterised. However, we were not able to find all parameters, and used values from other diseases (surrogate data) and assumed that they would be similar to Influenza. This surrogate data includes viral decay rate (where we used the vaccine virus and the assumption that the viral transfer rate from the fomites to hands were the same as the MS-2 bacteriophage. In order to improve the risk estimate, we would need this information. We also assumed that one infected person infects only one healthy person, although there are dozens of people in a store at a time. The risk of infection is larger because there are more people in the room, and we could have modelled for this. We also did not include deposition of the pathogen on the products from the contaminated hands of an infected person. This is a pretty likely scenario and would greatly improve our model.
Concerning the uncertainties in the risk assessment, we can say that uncertainty arises from many sources. Generally we can categorise them into statistical and structural uncertainty. Statistical uncertainty address sample variability, which analyses how parameter estimates vary with a different sample set from the same process. This type of statistical uncertainty is examined using the Monte Carlo analysis method in Crystal Ball. Structural uncertainty examines the assumptions and analyses the scenario. Different results may be obtained by beginning with different initial values.
Risk Management & Communication
To put forth a positive public, the company prevention image is to provide sanitary wipes and signs next to their products that say something like: “please use the provided sanitary wipes in order to help us prevent the spread of influenza during the holiday season.” These sanitary wipes can be provided so that customers can wipe their hands immediately after handling the product. They can either be placed on the countertops alongside the devices or at the exit, clearly marked and labelled.
Additionally, general sanitation practices as issued by the CDC should be used. Customers and employees should cover their noses and mouths with tissues when they cough or sneeze; tissue should be discarded after use. Hands should be washed with soap and water often, and if facilities are unavailable, and alcohol-based hand rub should be used. The general public should avoid touching the face, particularly the eyes, nose and mouth because these are entryways for pathogens to enter the body.
Other than these prevention methods, employees should try to avoid close contact with sick customers. If an employee is ill with flu–like symptoms, the CDC recommends that they stay home for at least 24 hours after the fever is gone. During this infectious period, contact with others should be limited as much as possible to prevent the spread of the pathogen.
Based on results of the risk assessment, risk of infection for influenza virus through exposure to contaminated surfaces such as plastic, aluminium, and glass is negligible and further measures for reducing risk are not necessary. If Grape Computer Company is still concerned about maintaining a clean store, they could implement a policy for workers to clean surfaces with disinfecting wipes throughout the day. Influenza viruses are sensitive to a wide range of chemical disinfectants (Favero, et. al,1991), including those with ingredients such as chlorine or hypochlorite, aldehydes, phenolics , alcohols, or peroxygen compounds (Prince, et. al, 2001). There are over 500 products recommended by EPA for use against influenza A viruses on hard, non-porous surfaces (EPA, 2011). For disinfection of electronic items such as phones and computers, CDC recommends using disinfecting wipes (CDC[2]). Directions for use of the wipes should be followed including appropriate contact time for disinfection (EPA, 2011) and those using the wipes should be sure electronics are compatible with use of disinfection wipes (CDC[2]).
Table 7. Disinfecting towlettes that are recommended by EPA for use in disinfecting non-porous surfaces for influenza.
| Brand of Wipe | Manufacturer | Active Ingredient | Cost |
|---|---|---|---|
| Dispatch hospital cleaner disinfectant towels with bleach | Caltech industries | Sodium hypochlorite | |
| Benefect botanical daily cleaner disinfectant towelette | OHSO clean, Inc | Thymol | |
| Lysol brand pre-moistened touch-ups disinfecting clean wipes | Reckitt Benckiser, Inc | Alkyl dimethyl benzyl ammonium chloride (50% C14, 40% C12, 10% C16) (69105) | |
| Opticide-3 wipes | Micro-Scientific Industries | Isopropyl alcohol, alkyl dimethyl benzyl ammonium chloride(60% C14, 30% C16 5% C18 5% C12) (69104) |
There are many ways of conveying the risk of ingesting pathogens from high-tech devices on displace at a store to the public. In our analysis, we considered the case of many customers shopping at the Grape store during the holiday season when there are large volumes of people shopping for gifts who may be knowingly or unknowingly shedding the Influenza virus. Based on results of the risk assessment, risk of infection for influenza virus through exposure to contaminated surfaces such as plastic, aluminium, and glass is negligible. The risk of infection due to inhalation still remains. Grape Computer Store should hold a staff meeting before flu season starts to update them on influenza symptoms and prevention of spread of influenza.
The calculations were performed by means of among others Markov chains and Monte Carlo simulations in the programme Crystal Ball. A division was made between an infected customer, who stays in the store for 45 minutes, and an infected employee, who stays in the store for 3 hours. Each infected person infects one other person. The calculations show that after every cough or sneeze the Influenza air concentration immediately increases up to maximum 25,000 particles per m-3. Up to the next cough/sneeze, the concentration will slowly decrease again linearly. The concentration patterns on the fomites have similar patterns. The concentrations reach values of approximately 1.10-50 m-2 on all fomites.
Concerning the actual Influenza doses for customers and employees, the largest values are obtained by inhaling the Influenza virus. Concerning the risks of infection, the largest risk for the customer is obtained after inhaling the Influenza virus (1:7.82e-6). For the employee the largest risk is also obtained after inhaling the Influenza virus (1:1.03e-5).
If Grape Computer Company is still concerned about maintaining a clean store, they could implement a policy for workers to clean surfaces with disinfecting wipes throughout the day. Influenza viruses are sensitive to a wide range of chemical disinfectants, including those with ingredients such as chlorine or hypochlorite, aldehydes, phenolics , alcohols, or peroxygen compounds. There are over 500 products recommended by EPA for use against influenza A viruses on hard, non-porous surfaces. For disinfection of electronic items such as phones and computers, CDC recommends using disinfecting wipes. Directions for use of the wipes should be followed including appropriate contact time for disinfection and those using the wipes should be sure electronics are compatible with use of disinfection wipes.
In summary:
- Both scenarios (risk to customers vs. risk to workers and risk from contacting different fomites) were very low for contact with contaminated surfaces (10-13).
- The risk of infection via inhalation for customers was an order of magnitude lower than the risk for employees.
- The combined risk of infection via inhalation and contact with contaminated surfaces for customers was an order of magnitude lower than the combined risk for employees.
- For the customer scenario, contact rate had the most influence on the model for risk of infection by contacting contaminated surfaces whereas for the employee scenario, concentration on surfaces had the most influence.
Appendix A
We wanted to look at long-term effects after customers are exposed to the influenza virus at the Grape Store. We took the scenario that one customer got infected from shopping at the Grape Store. This person could either be asymptomatic and be transmitting the disease, or could still be shedding the virus before symptoms even manifest in him. We considered the case that the customer went in to work in a large office, containing 500 other employees. We determined the parameters to be:
| Parameter | Value |
|---|---|
| pickup | 0.0001 |
| infectivity | 0.0125 |
| recovery | 0.99968 |
| shedding | 200 |
| inactivation | 0.03 |
| maxTime | 200 |
| maxPeople | 500 |
We used the Susceptible-Infected-Susceptible via the Environment (SIS-E) model to determine the number of people who are susceptible (in blue) or infected (in red) over a time step. We were also able to model the number of pathogens in the environment over time. See figure 6.1.
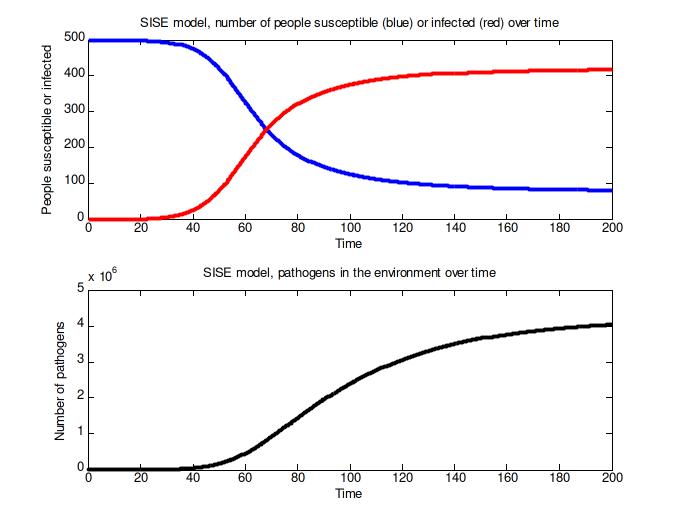
Figure 6. Results of the SISE model.
References
Behavioral Risk Factor Surveillance System. (2011, February). Interim estimates of cumulative influenza vaccination coverage for 2010-11 season*-United States, end of February 2011. Retrieved August 2011, from Vaccination Coverage for Selected Area(s): https://dl-web.dropbox.com/get/Photos/QMRA%20Case%20study%202/flu%20ohio?w=cd25a378
CAMRA. (2011, August). Fomites. Retrieved August 2011, from CAMRA Wiki: http://wiki.camra.msu.edu/index.php?title=Fomites
References
- (2011). Flu Symptoms and Severity.
- (2010). Estimates of Deaths Associated with Seasonal Influenza-United States 1976-2007. Morbidity and Mortality Weekly Report. 59(33),
- (2011). Overview of Influenza Surveillance in the United States.
- (2011). Apple Retail Store Over 300 stores worldwide.
- (1998). Characterization of infectious aerosols in health care facilities: An aid to effective engineering controls and preventative strategies. American Journal of Infection Control. 26(4),